← All work
AustralianSuper
Making super feel real on mobile
Over three strategic releases, the app became the main way more than a million members engage with their super.
The 20-second version
My roleLead UX Designer
- Members didn’t have enough clarity to act. Then COVID hit, and they needed answers fast.
- I drove the UX roadmap from scratch and owned it across three releases, with a 20% UX allocation per release in the early days.
- I put real friction ahead of cosmetic uplift: login first, then the dashboard, then performance.
- Each release built on the last. Interactions grew 25×, from 300K to 7.6M a month.
25×Interaction growth300K → 7.6M a month, across three releases
5MMonthly visitsThe app is now the main digital channel
The starting point
An untapped channel
Mobile wasn’t yet a priority, and it wasn’t clear what members or the business needed from the channel. Then COVID hit. Markets swung, members flooded the app, and they needed answers fast.
First move · Access
Remove friction at the front door
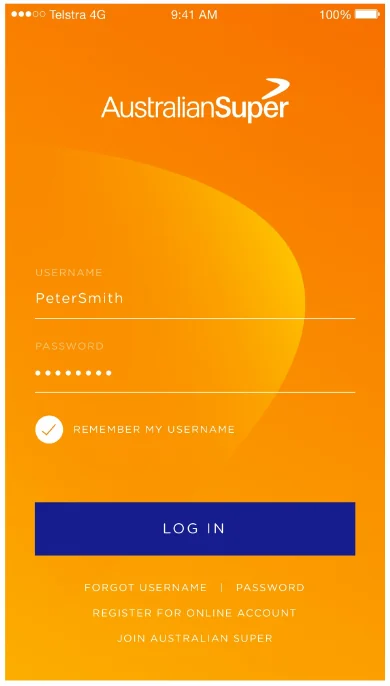
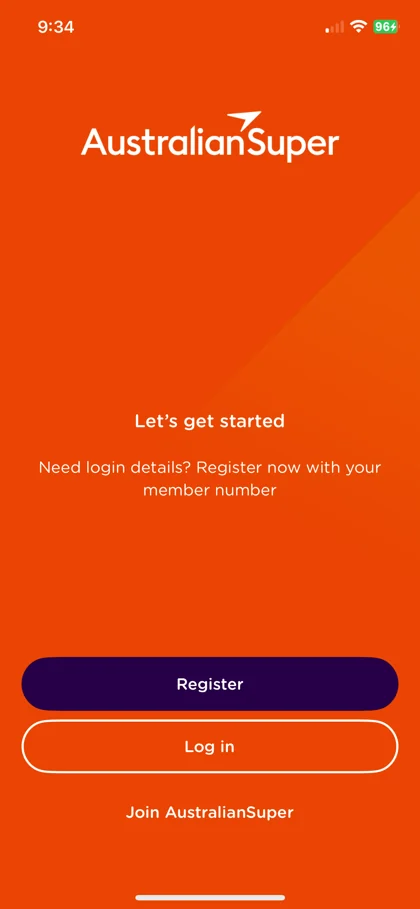
Login was the biggest thing stopping members from using the app, right when they needed it most.
25 → 5 secto log in. Successful logins rose from 85% to 95%.
See what changed
Made it easy to findMoved biometric login out of deep settings and into the main menu.
Nudged the right peopleUsed Firebase messages to nudge 50–80K password-only members towards biometric login.
On by defaultMade biometric login the recommended path during onboarding.
| Measure | Before | After |
|---|---|---|
| Login failures | 15% | 5% |
| Quick-login adoption | 5–10% | ~30% |
| Login and registration calls, per 1,000 | ~14 | ~10 |
| Sessions per week | 0.9 | 1.5 |
| Monthly users who visit daily | 15% | 25% |
 Before
 After
App 2.0 · Clarity
Simplify complexity so members can act
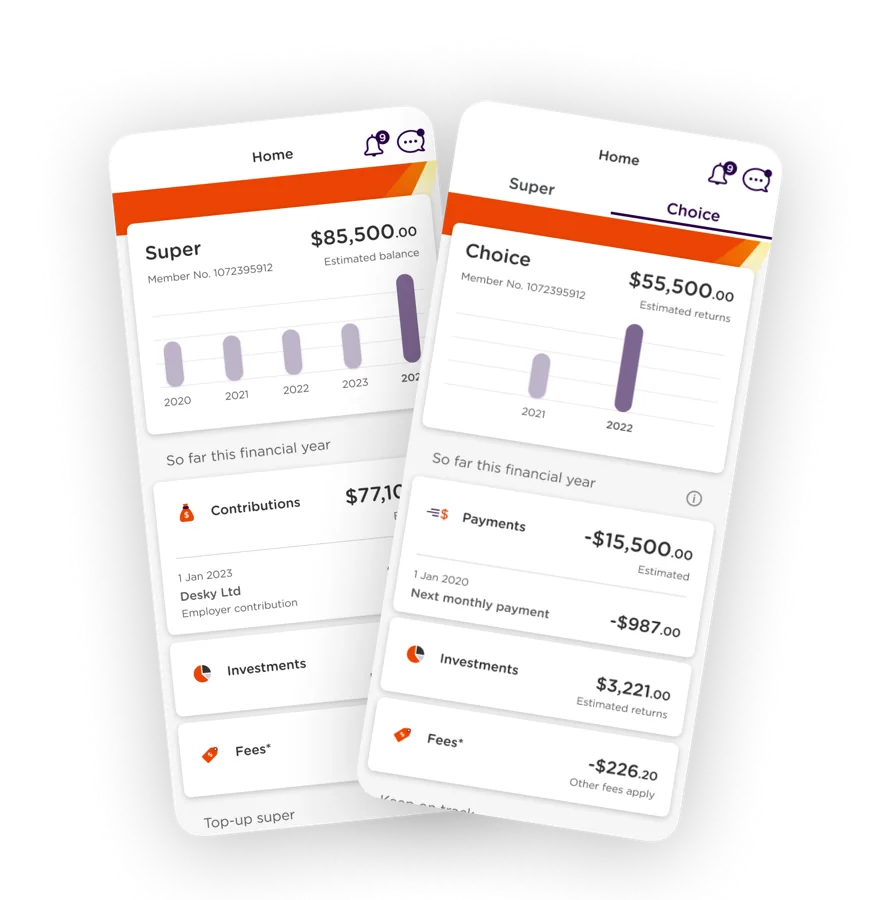
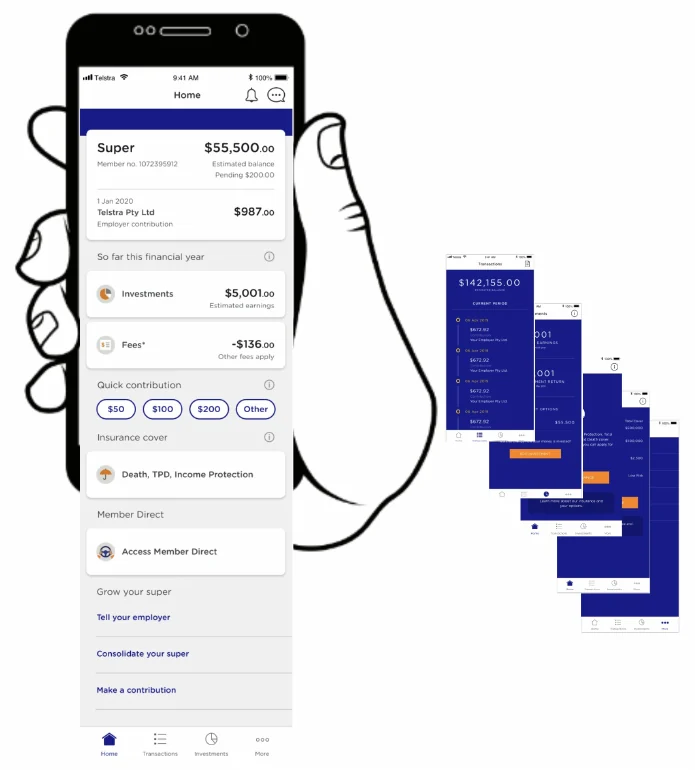
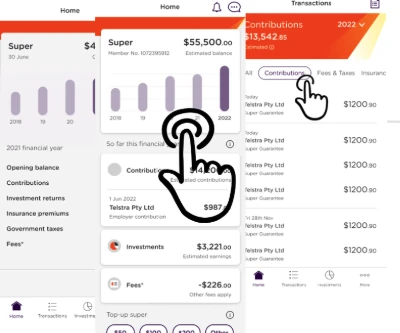
Members wanted four things at a glance: balance, contributions, returns and fees.
+50%more monthly users by App 2.0, from ~0.5M to ~0.75M, building on the login fixes.
See what changed
One structure for everyoneThe same navigation whether members are retired or still building their super.
The four things firstBalance, contributions, returns and fees, right up front.
Looks like the websiteMatched the desktop design, so members feel secure and in the right place.
| Measure | App 1.0 | App 2.0 |
|---|---|---|
| Members using the app | 15–20% | ~25% |
| Monthly active users | ~0.5M | ~0.75M |
App 3.0 · Performance
Show, don’t tell
13% of complaints came from members wanting to see how their super was tracking.
15M+taps on the performance graphs, and 29% more retirees using the app.
See what changed
Interactive performance graphsYear-on-year returns, fees and insurance, with a tap to drill deeper.
All transactions in one placeSorted into categories, using familiar patterns. Clarity over novelty.
Start small, then buildThe most important screens first, so members got value sooner.
The result
What changed for members
Before: Little visibilityAfter: Clear view of their super
Before: Uncertain what to doAfter: Confident to act
Before: Set and forgetAfter: Reasons to return